A long time ago I theorised that the Sand Rover and Holiday buggy would become the "new" SRB in terms of collectability, prices would rise slowly, but in a non-linear fashion, going exponential and peaking at silly values just before the announcement of re-releases. As we now know, there was no spike in prices, and the re-release was barely a re-release at all (and it came very quickly after my hypothesis).
What this did give me though was a set of data relating to prices over time - so I presented that (in another place), complete with graphs with near horizontal lines, and demonstrated that the re-release had no effect on prices, and that the value of both buggies was remarkably flat.
The reason I mention this is this: I know some people read as much as Champion the Wonder Horse, but the post included graphs. Graphs with flat lines. It appears that those who read it was unable to grasp my points as stated in the text - and also unable to interpret a graph with a flat line as meaning _no change_ . I know this because the comments were of two distinct types: firstly "yeah it sucks Tamiya rereleasing everything they shouldn't do it cause it makes everyones cars worth less", and secondly "yeah prices are climbing mental".
To summarise, I'm not overly hopeful about this post being that different to the casual reader, though obvious I'd hope the average Tamiyabase contributor is better informed

First, a few notes about the data:
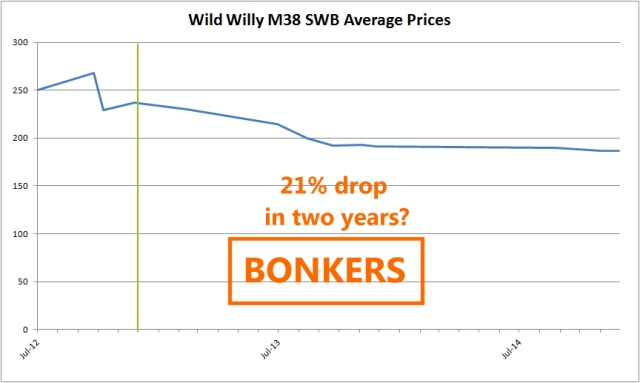
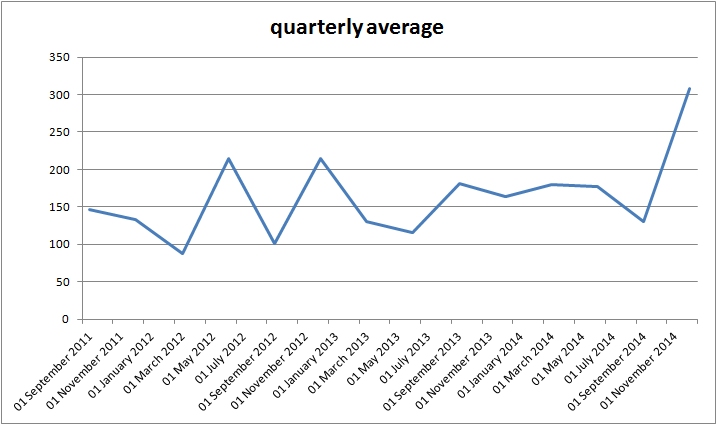
Wild Willy M38 SWB averages: based on 15 sales July 2012 to December 2014
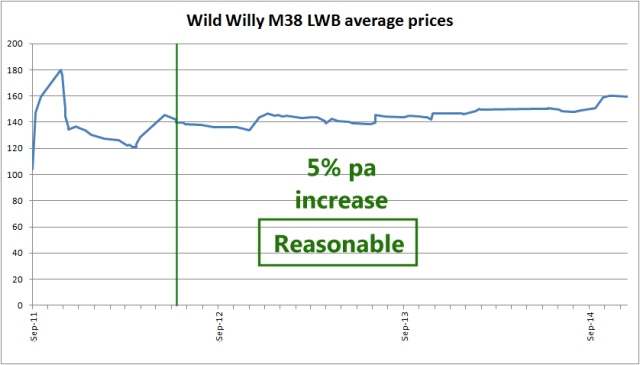
Wild Willy M38 LWB averages: based on 83 sales September 2011 to December 2014
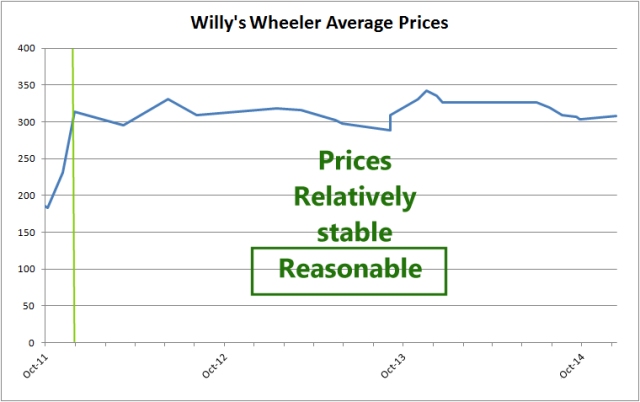
Willy's Wheeler averages: based on 24 sales October 2011 to December 2014
THe first thing anyone's going to ask about those numbers is why so few? The thing is, for a price to be valid it has to have been publicly visible - anything traded on a forum, over facebook messages and so on can't count, you may know the asking price but there's no way of knowing the final price agreed. Similarly, cars up at "best offer" prices on eBay are no longer auditable, as eBay has been hiding the actual final value for some time. In addition, although most people when they see a car up at a buy it now price of X hundred whatevers assume that when it is no longer visible, it "must" have sold for that - when that simply isn't true, in a lot of cases it will have sold for a lot less outside of eBay, and that price simply isn't auditable.
Consequently, the only prices used are visible eBay final values, and I can't guarantee I captured every single M38 SWB, LWB or Wheeler sale on (English speaking) eBay in the relevant period.
Because the data sets for the SWB and Wheeler are so small, the methodology behind the graphs could be seen as somewhat flawed - the data includes all sales of complete cars (meaning having a body, chassis and at least 3 wheels) were included regardless of condition from junker to NIB (albeit examples at either end, especially the good end were exceptionally rare) as excluding them would have reduced the data set further.
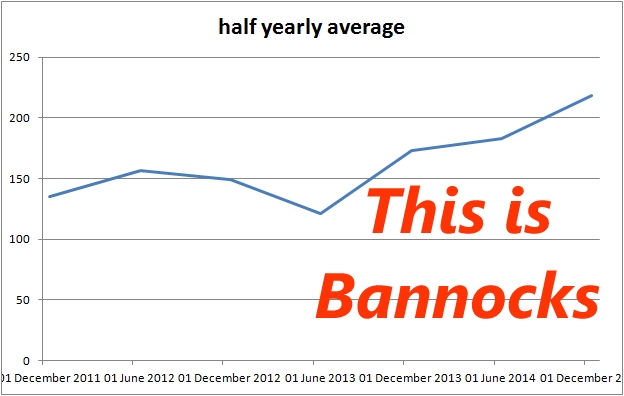
The averages are the arithmetic mean of the price on a sale date, plus all the preceding sales. For example, the average on the 5th sale is the mean of the first 5 sales, the 15th value is the average if the first 15 sales and so on. This has the advantage that any volatility in values is damped out, but can have the disadvantage that as the size of a data set increases over time, trends become less obvious. I don't consider that to be a problem in these small sets.
Note the green vertical lines on the graphs: I'd consider anything to the left of those to be unsafe for the purposes of drawing conclusions, anything to the right as sound. Such measures are necessary given the size of the set and the volatility (variation in prices adjacent in time). For example, sufficient "damping" of the LWB prices has occurred by the beginning of July 2012.
Note that all the values used in working out the averages included local postage as stated by the seller. This seems reasonable to me, as if you're buying an RC car, most of the time you have to pay that cost too, although it should be noted that this will have had a small inflationary effect on prices. Due to the way I've summarised the data it's no longer possible to strip out the postage costs for all the data.
Where no postage cost was stated or the car was pick up only, it was excluded.
This does mean that the value to sellers is not going to be anything like the values stated here - account has to be taken of listing fees, final value fees, Paypal fees, packing costs, subsidising the ever increasing cost of posting to avoid seeming to be guilty of usury or whatever the equivalent sin relating to shipping charges is, ... I think we're looking at least a 15% reduction, and of course the fact sellers don't get to keep the postage cost either.
So what does the data - and the graphs - actually tell us?
Wild Willy M38 LWB: prices have risen from an average of 140 GBP three years ago, to 160 GBP now. This is in line with expectations, although the increase or 15% may be more modest than expected. 5% per annum sounds like quite a good return though, doesn't it?
Wheeler: Prices remarkably stable around the 310 GBP mark. This flies in the face of "common sense", which states that all RC prices are rising, and especially rarer cars like this.
SWB Willy: TBH this result stretched my credulity to breaking point: apparently the average price of a short wheelbase Willy, the rarest of the 3 cars here has fallen in the last two years from 235 GBP to 185 GBP - a premium of only 25GBP over the much more prevalent "Long" wheel base version. I delved deeper, but there are no NIB cars skewing the data, nothing to suggest that all the good ones were sold early and poorer ones make up the sales now ... this apparent 21% fall in two years I can only put down to the small number of figures available - I suspect all that's happening here is there aren't enough figures for the average to have become stable yet.
TBH the only conclusion I'll really stand behind is the modest increase on LWB prices (and to a certain extent, the Wheeler figures): outstripping inflation, but only modestly so. But with our sensible trousers on, didn't we really know that anyway?